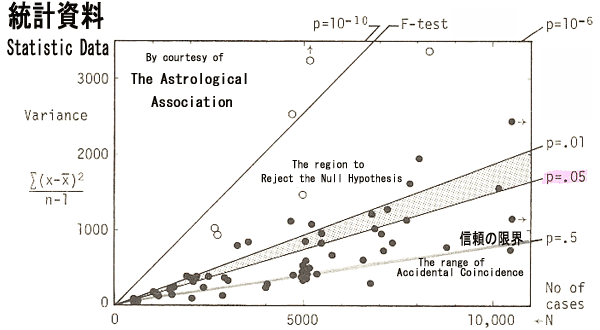
The above illustration will indicate the reliability of reported research data of 290,738 or three hundred thousand approximately cases released in the 600 pages
book of Recent Advances in Natal Astrology published under the aegis of The Astrological Association AA in 1977.
The number of samples in the researches reported against the value of Variance calculated. The probability line
of p=0.05 in red marked will indicate the odds against chance in the occurrence of ration for 20 to one. The data
found in the above space of this line will be in the region to reject the null hypothesis or the hypothesis

of denial of astrology that these
laws of astrology will be reliable for prediction of item performed. Several of white circles including the aircraft disasters
studied by this author

will be enough for high level of significance that the reports are reliable. The most
reports found in the black circles below the line of p=0.01 or in the odds against chance of the ratio for 100 to one will be
the researches came from unreliable data in the rage of accidental coincidence classified.
Students must be very careful to test the preferable method of choice in one sign among twelve sets of signs.
The probability to make a choice, for instance the Aries sign out of twelve signs will be p= 1/12 or 0.083. Therefore,
we should have p=0.05 or less for the calculated p in the compiled data before we can clear the rejection of the null
hypothesis in which the reliability of astrology was denied temporally settled. Traditional simple method to compare
the obtained number of cases in the preferred system against that of found in the other case might not be accepted
unless the preferred data is in p=0.05 or far less. As you will find in the white circles of the reliable test of examples in the
range of p=0.000001 or less, these data will be reliable enough to reject the null hypothesis. On the other hand,
the black circles of most astrological examples are located in the region of the accidental coincidence.


 統計資料です。図の横軸は資料数で、縦軸は分散値を
示します。確率を示す斜めの線で、赤印で示す p=0.05 (硬貨を十回投げて表が一回出る確率)の線よりも
上方では、硬貨を十回以上も投げて表が一回出るような稀な確率を示す特徴が存在する資料です。資料のすべての
ものが線よりもさらに上方に存在をすれば、その法則は「占星学を信頼できないという・負の仮説
 」(帰無仮説)を
捨て去る(排除する)ことが出来るので、占星学として信頼ができる資料です。図の白丸
 で示す研究は、筆者が研究した
航空機事故のアスペクトの法則
 などの占星学を信頼できる部分に表示された研究例です。多くの過去の
研究は図の黒丸が集中しているように、硬貨を百回投げて表が一回出る確率 p=0.01 よりも下方ですから、
図のさらに下方のp=0.5 (全くの偶然、一回投げて一回表が出る確率)に近い範囲の資料であり、偶然に的中をした信頼できない研究例です。
 で表示した実験では、
p=0.0001 (硬貨を一万回投げて表が一回出現するような確率)を示す特殊存在が通例的に多数発生しているので信頼できます。
しかし、黒丸で示す研究例は信頼の限界に近い研究ですから、研究者の個人的な好みによって研究資料の選定方法が
変化すれば、的中率も変化するので信頼できない研究です。